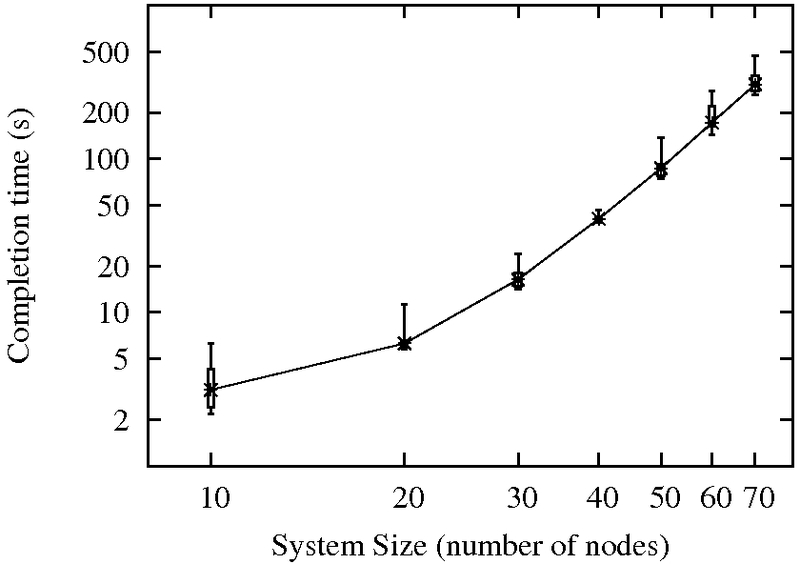
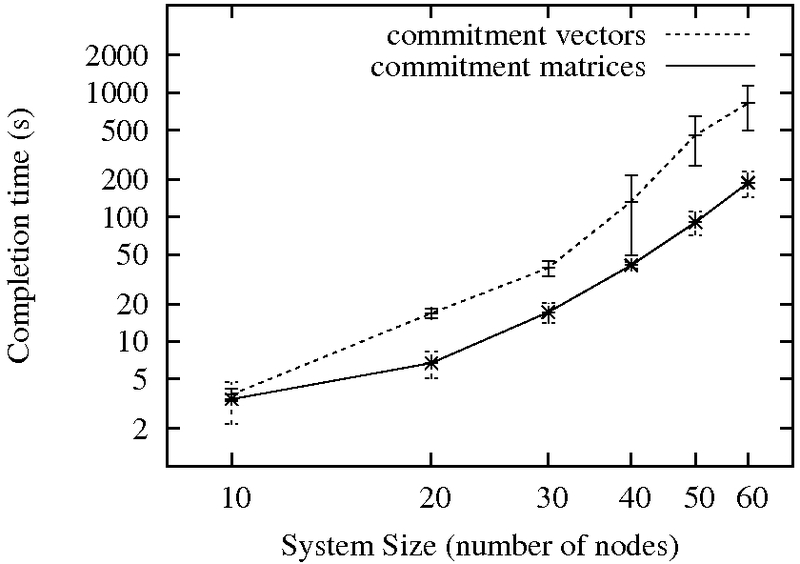
The average running time with commitment matrices with 0.95 two-sided confidence interval computed using t-distribution:
| n | t | f | Running Time (seconds) | CPU Seconds/Node |
| 10 | 1 | 3 | 3.43 ± 0.91 | 0.64 ± 0.08 |
| 20 | 2 | 6 | 6.71 ± 1.18 | 3.11 ± 0.77 |
| 30 | 3 | 10 | 17.16 ± 2.25 | 9.62 ± 1.03 |
| 40 | 4 | 13 | 40.98 ± 1.65 | 25.67 ± 0.74 |
| 50 | 5 | 17 | 90.69 ± 13.87 | 53.14 ± 5.77 |
| 60 | 6 | 20 | 188.32 ± 31.09 | 85.15 ± 4.66 |
| 70 | 7 | 24 | 325.31 ± 45.67 | 173.85 ± 28.85 |
The average running time with commitment vectors with 0.95 two-sided confidence interval computed using t-distribution:
| n | t | f | Running Time (seconds) | CPU Seconds/Node |
| 10 | 1 | 3 | 3.73 ± 0.30 | 1.62 ± 0.18 |
| 20 | 2 | 6 | 16.87 ± 1.06 | 8.88 ± 0.35 |
| 30 | 3 | 10 | 38.89 ± 3.81 | 23.33 ± 0.50 |
| 40 | 4 | 13 | 133.20 ± 59.82 | 54.48 ± 7.03 |
| 50 | 5 | 17 | 455.36 ± 139.52 | 96.15 ± 25.45 |
| 60 | 6 | 20 | 819.51 ± 228.20 | 263.29 ± 38.92 |
A quartile plot of running time with commitment matrices:
A comparision between commitment matrices and commitment vectors in terms of mean running time and standard deviation:
Download the list of nodes used for our experiment here.